
doc_type: Tutorial title: Getting Started with the mspec Web UI
Getting Started with the mspec Web UI
In this tutorial, you will open the mspec Web UI for the first time, navigate each of its pages, and learn what each view is telling you about your changes. By the end, you will be able to use the dashboard to track your workflow, inspect artifacts, read specs, and interpret test results.
Prerequisites:
mspec inithas been run in your project.- You have run at least one change through the workflow (e.g.,
mspec new my-featurefollowed by a fewmspec continuecalls).
1. Starting the Web UI
The Web UI starts automatically whenever you run mspec new <feature> or mspec continue. You do not need to take any extra steps — mspec launches the server in the background and prints the URL to your terminal.
If you want to start the server on its own, run:
mspec continue # starts the server if not already running, prints the URLOpen your browser and navigate to:
http://localhost:3847Port configuration: The default port is
3847. To change it, edit.mspec/config.yamland set theui.portfield.
What you should see: The mspec dashboard loads with a list of your changes in the main area. If you have run at least one change, at least one row appears.
2. The Dashboard
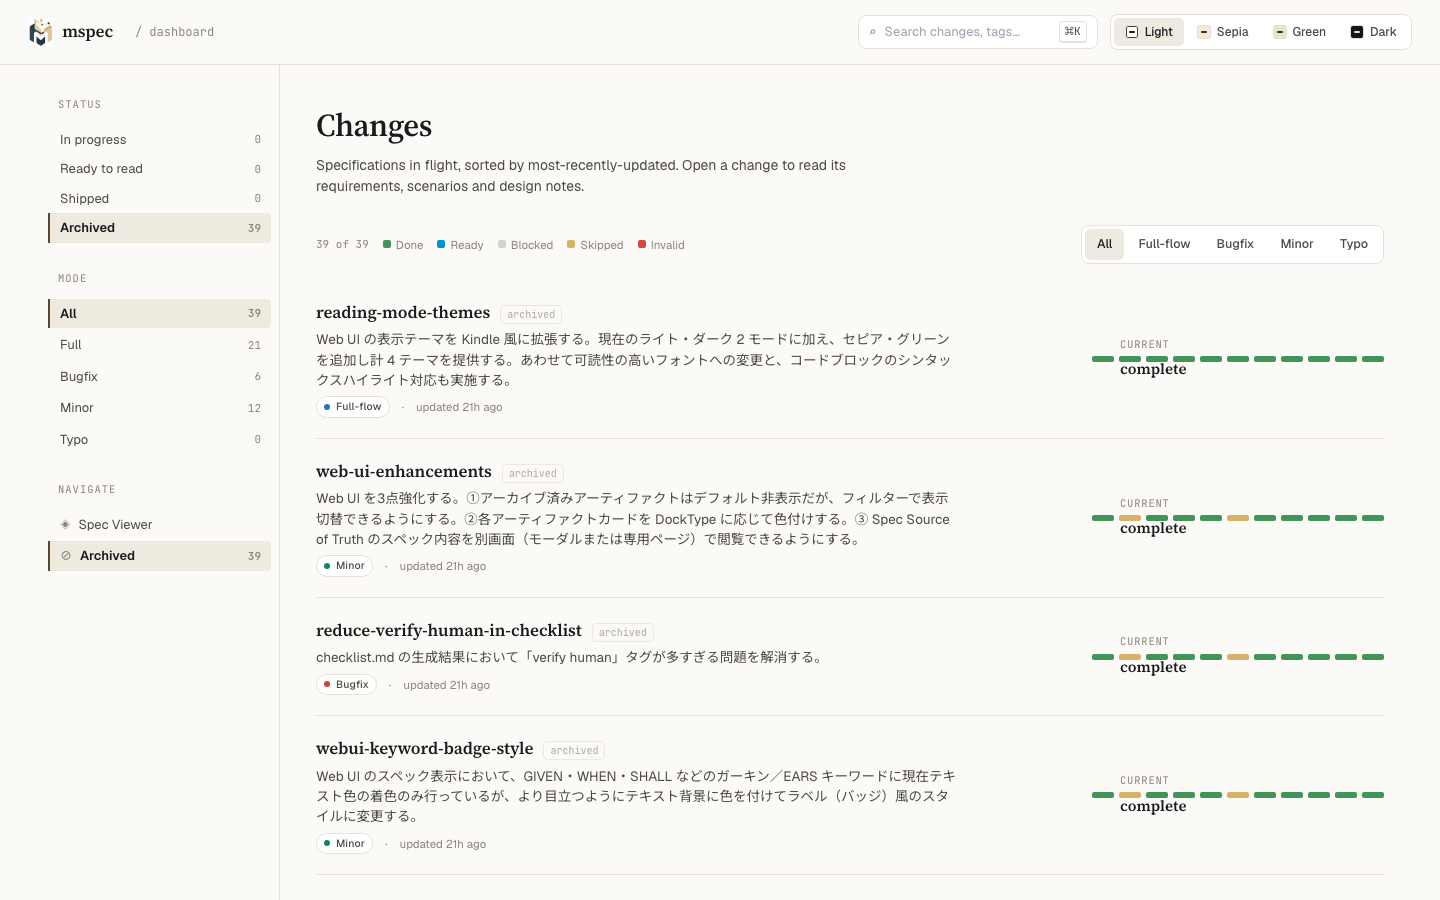
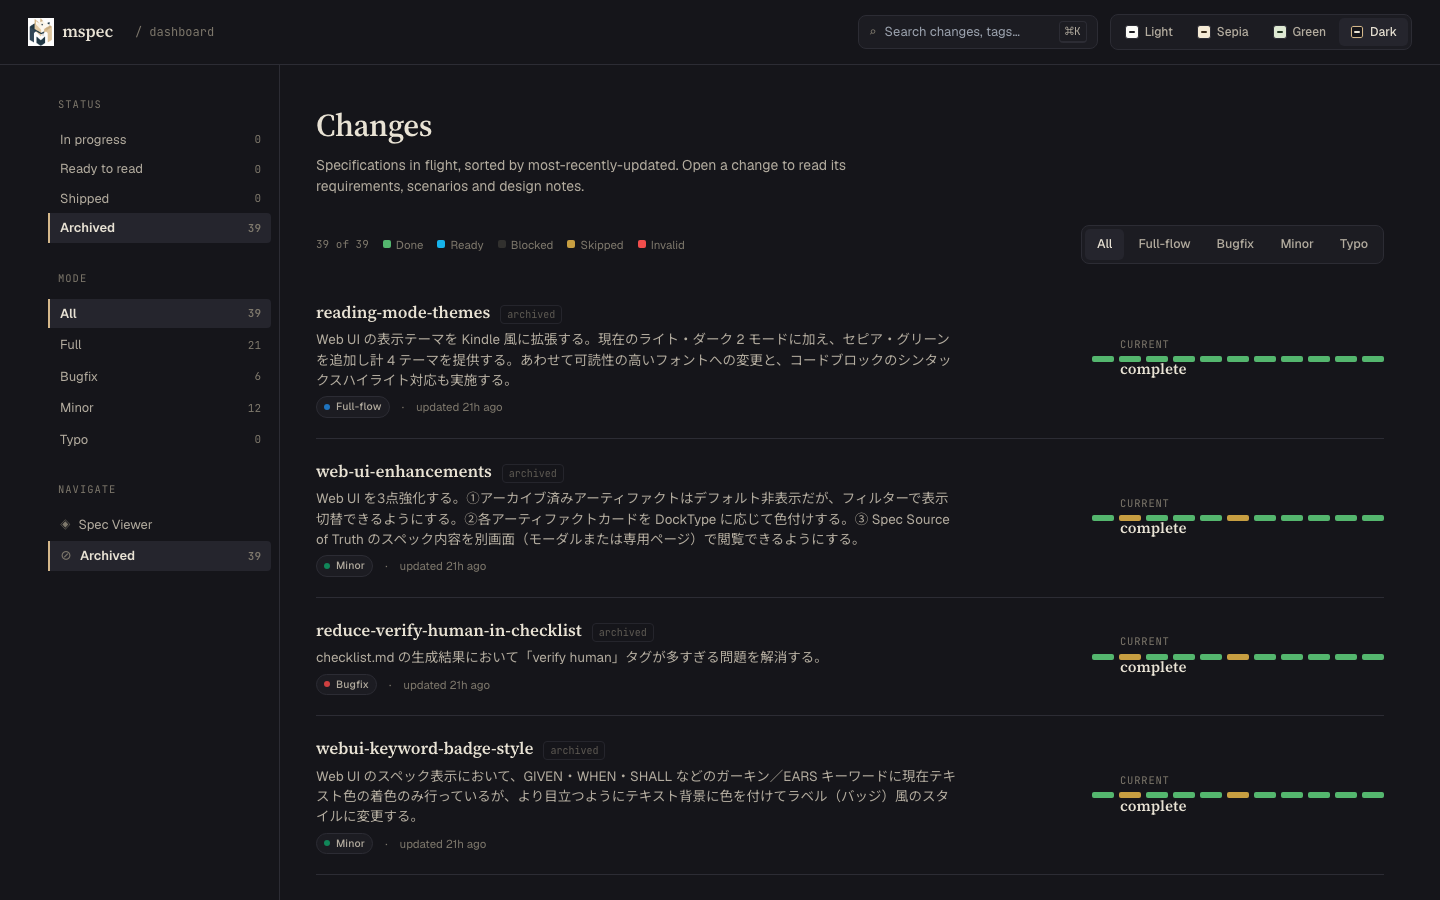
The dashboard is your home base. Here is what you are looking at:
Change list
Each row in the main area represents one change. Left to right, each row shows:
| Element | What it means |
|---|---|
| Title | The change name you supplied to mspec new |
| Mode chip | One of full, bugfix, minor, or typo — the scope of the change |
| Artifact counts | How many files (proposal, checklist, tasks, design, etc.) exist for this change |
| Relative timestamp | When the change was last touched (e.g., "3 minutes ago") |
| Current step | Which workflow step is active right now |
| Step progress bar | A color-coded strip showing the state of every step |
Step progress bar colors
The progress bar encodes the state of each workflow step at a glance:
| Color | Meaning |
|---|---|
| Green | Done — the step completed successfully |
| Blue + pulse | Ready — this is the active step, waiting to run |
| Gray | Blocked — prerequisites are not yet met |
| Yellow | Skipped — the step was intentionally bypassed |
| Red | Invalid — the step output failed validation |
Left sidebar: filters
Use the left sidebar to narrow the list:
- Status filters — show only changes in a given state (e.g., in-progress, done, blocked).
- Mode filters — show only changes of a specific scope (full, bugfix, minor, typo).
Search box
Type in the search box at the top of the change list to filter by name, title, summary, or tags. The list updates as you type.
What you should see: After applying a filter or typing in the search box, the change list narrows to matching rows only. Clearing the search restores the full list.
3. Opening a Change
Click any row in the change list to open the ChangeDetail view for that change.
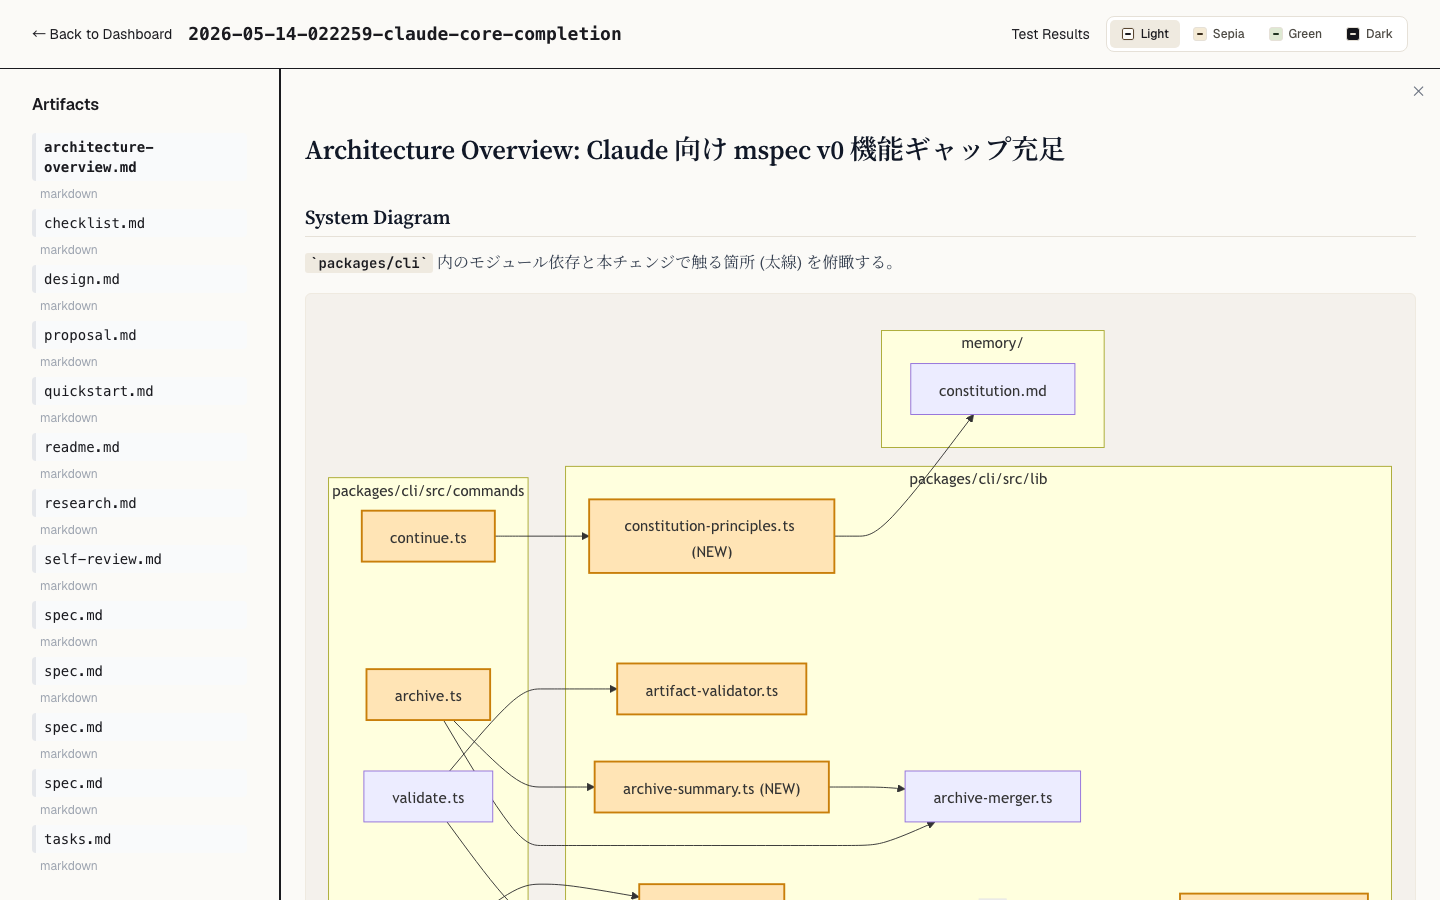
Artifact list
The left panel shows every artifact that belongs to the change. Each artifact has a color-coded left border that tells you its Diátaxis documentation type:
| Border color | Diátaxis type | Typical artifact |
|---|---|---|
| Blue | Reference | spec, delta spec |
| Purple | Explanation | design rationale, architecture overview |
| Green | How-to | tasks, checklist |
| Yellow | Tutorial | quickstart, tutorial docs |
Inline split-panel preview
Click any artifact in the left panel to open it in the right panel without leaving the page. The viewer renders:
- Markdown with full GitHub Flavored Markdown support (tables, task lists, strikethrough, etc.)
- Mermaid diagrams — sequence diagrams, flowcharts, and ER diagrams render as SVG inline.
- Code blocks — syntax highlighting for all common languages.
- EARS / Gherkin keywords — requirement keywords (
The system shall,Given,When,Then) are colorized for fast scanning.
What you should see: Clicking an artifact splits the view. The left panel stays visible so you can switch between artifacts without losing your place.
4. Reading a Spec in the Spec Viewer
The Spec Viewer lets you browse the source-of-truth spec files for every capability in your project.
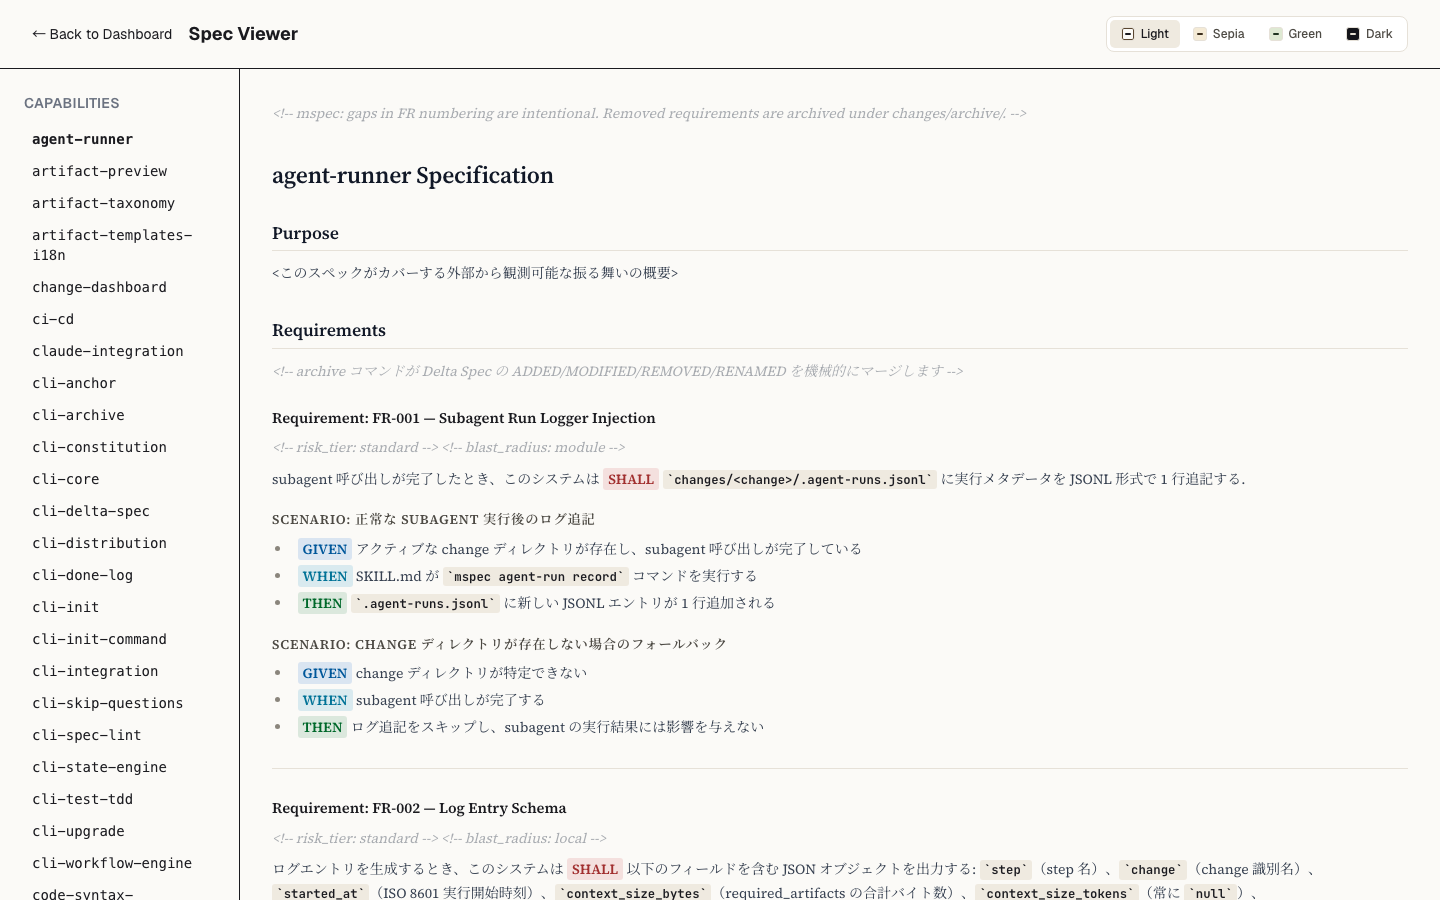
To open it, either:
- Click Spec Viewer in the top navigation bar from any page, or
- Go directly to
http://localhost:3847/spec-viewer.
Navigation
The left sidebar lists every capability that has a spec. Click a capability name to load its spec in the main area. The spec renders with the same full markdown engine used in ChangeDetail — Mermaid diagrams, syntax highlighting, and EARS/Gherkin colorization are all active here too.
What you should see: The spec for the capability you selected fills the main area. Mermaid diagrams render as diagrams, not raw text. Requirement keywords appear in color.
5. Viewing Test Results
From any ChangeDetail view, click the Test Results button in the header to open the test results panel for that change.
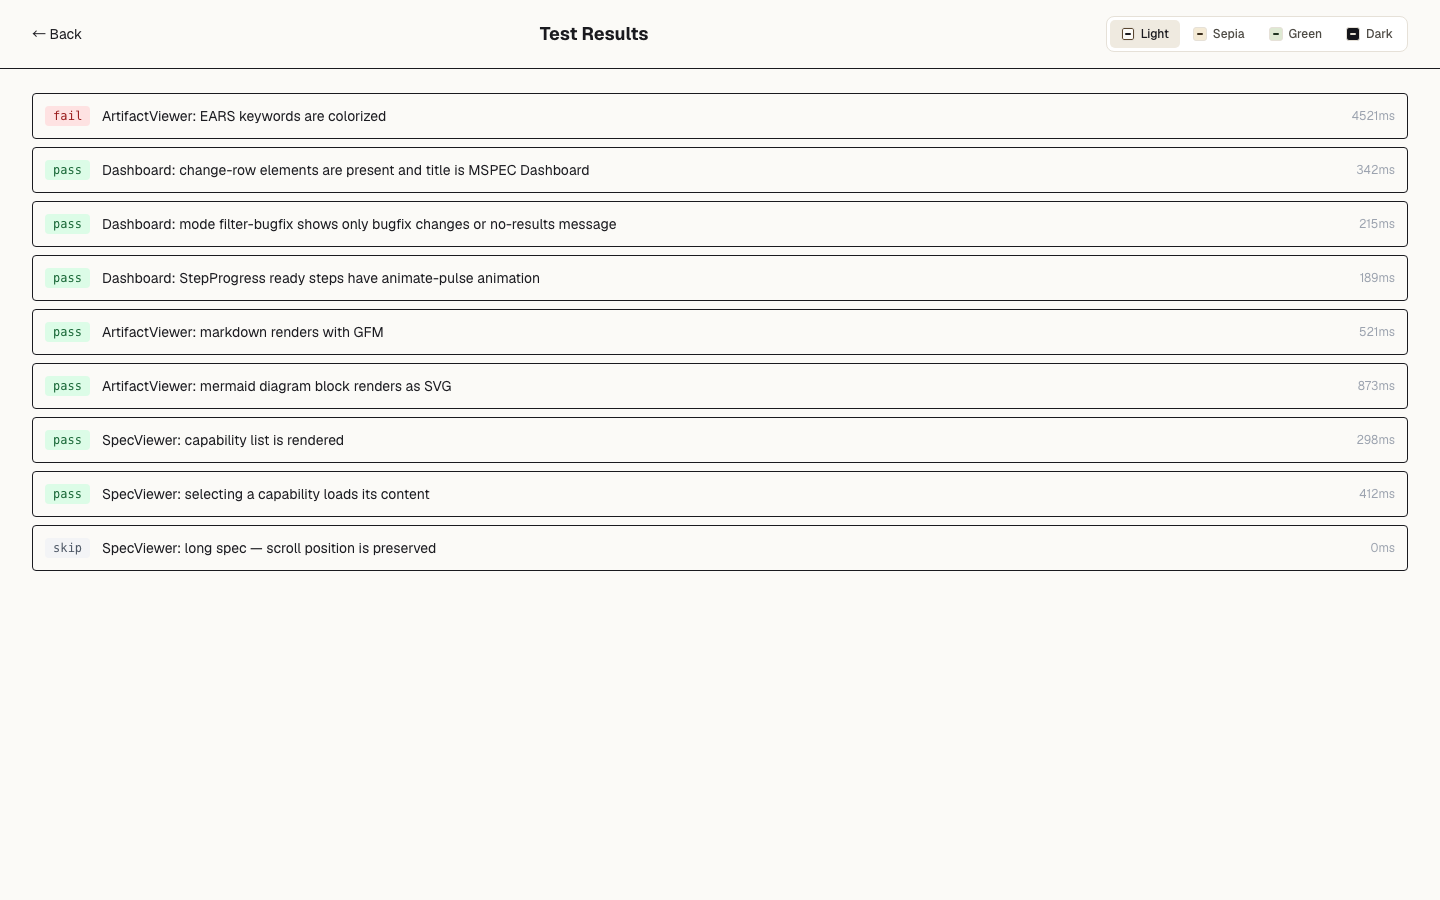
The panel shows every test case that was run for the change, with one of three statuses:
| Status | Badge color |
|---|---|
| Pass | Green |
| Fail | Red |
| Skip | Gray |
Failed test cases sort to the top automatically. Click a failed test to expand it and read the full error message and stack trace inline.
What you should see: If all tests pass, you see a green summary at the top and a list of green-badged test cases. If any test failed, it appears at the top with a red badge; clicking it reveals the error details.
6. Switching Themes
The Web UI ships with four themes. To change the theme, click the theme picker in the top-right corner of any page and select one:
| Theme | Character |
|---|---|
| Light | Clean white background, default |
| Sepia | Warm off-white, easy on the eyes for long reading sessions |
| Green | Terminal-inspired green-on-dark |
| Dark | Full dark mode |
Your selection is saved in the browser. The next time you open the Web UI, your chosen theme loads automatically.
What you should see: The entire UI — navigation, sidebar, main area — switches to the new theme immediately without a page reload.
Summary
You have now:
- Started the mspec Web UI and confirmed it is running at
http://localhost:3847. - Used the dashboard to read the change list, filter by status and mode, and interpret step progress bars.
- Opened a change and used the split-panel artifact viewer to read proposals, specs, and design docs with full Markdown and Mermaid rendering.
- Navigated to the Spec Viewer to browse source-of-truth specs.
- Inspected test results and expanded a failed test to read its error trace.
- Switched the UI theme to match your preference.
From here, explore the rest of the mspec workflow. The Web UI updates in real time as mspec continue advances your changes — keep it open in a browser tab while you work to maintain a live overview of your project.